Regions of Interest (ROIs) in SimBA
The SimBA region of interest (ROI) interface allows users to define and draw ROIs on videos. ROI data can be used to calculate basic descriptive statistics based on animals movements and locations (such as how much time the animals have spent in different ROIs, or how many times the animals have entered different ROIs). Furthermore, the ROI data can be used to build potentially valuable, additional, features for random forest predictive classifiers. Such features can be used to generate a machine model that classify behaviors that depend on the spatial location of body parts in relation to the ROIs. CAUTION: If spatial locations are irrelevant for the behaviour being classified, then such features should not be included in the machine model generation as they just only introduce noise.
Before analyzing ROIs in SimBA
To analyze ROI data in SimBA (for descriptive statistics, machine learning features, or both descriptive statistics and machine learning features) the tracking data first has to be processed the up-to and including the Outlier correction step described in [Part 2 - Step 4 - Correcting outliers]. Thus, before proceeding to calculate ROI based measures, you should have one CSV file for each of the videos in your project located within the project_folder\csv\outlier_corrected_movement_location sub-directory of your SimBA project.
Specifically, for working with ROIs in SimBA, begin by
A short explanation on what is meant by “using ROI data as features for random forest classifiers” When ROIs have been drawn in SimBA, then we can calculate several metrics that goes beyond the coordinates of the different body-parts from pose-estimation. For example - for each frame of the video - we can calculate the distance between the different body-parts and the different ROIs, or if the animal is inside or outside the ROIs. In some instances (depending on which body parts are tracked), we can also calculate if the animal is `directing towards the ROIs <https://github.com/sgoldenlab/simba/blob/master/docs/ROI_tutorial.md#part-3-generating-features-from-roi-data>`_(see below for more information). These measures can be used to calculate several further features such as the percentage of the session, up to and including the any frame, the animal has spent within a specific ROI. These and other ROI-based features could be useful additions for classifying behaviors in certain scenarios.
Part 1. Defining ROIs in SimBA
In the main SimBA console window, begin loading your project by clicking on
FileandLoad project. In the [Load Project] tab, click onBrowse Fileand select theproject_config.inithat belongs to your project.Navigate to the ROI tab, which should look like this:
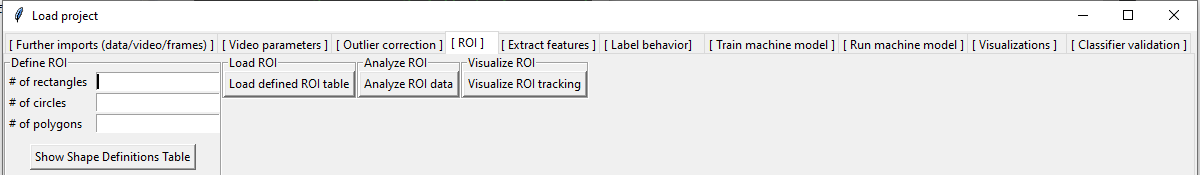
Begin at the left hand side of the ROI tab: using the sub-menu Define ROI. This menu lets you define the number of rectangles, circles, and polygons that you which to draw on the videos in the project.
Note
All videos in the project needs to contain the same number of shapes. For example, if you wish to analyze four ROIs in the first video of your project, but only three ROIs in the second video of your project, then you still need to draw four ROIs for both the first and second video in your project.
In the entry boxes associated with each shape, enter the number of each shape that you wish to draw. If you do not want to draw a specific shape, then leave the entry box empty.
Once you’ve entered the number of shapes that you wish to draw, then click on the
Show Shape Definitions Tablebutton and the following table will pop up.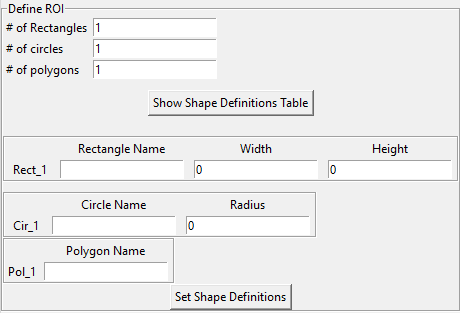
In this table, enter a name for each of your shapes in the Rectangle Name, Circle Name, and Polygon Name entry boxes. Make sure that the names of each of the shapes are different from each other - e.g., there cannot be teo shapes that are both named Area_1. When all the shape names have been entered, click on the Set Shape Definitions button which is located at the bottom of the Shape Definitions Table.
Note
Each Circle and Rectangle row has further size-related columns associated with them: Width, Height, or Radius. These columns are set to 0 and should, for now, remain set to 0. These settings will - in future version of SimBA - be used to draw shapes that are of precise metric sizes (e.g., a 40x40mm rectangle).
After clicking on the
Set Shape Definitionsbutton, the following table will pop open.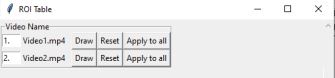
This table contain one row for each of the videos in the project. Each video in the project has three buttons associated with it: Draw, Reset, and Apply to all. The functions associated with each button is described in detail below. However, in brief, the Draw button allows you to start to draw the defined shapes on the specific video. If drawings already exist for the specific video, then the Draw buttons opens an interface where you can move the shapes that has previously been drawn on the video. The Reset button deletes any drawing made on the specific video and allows you to restart the drawings from scratch by next clicking on the Draw button. The Apply to all buttons copies the drawing made on the specific video and replicates it on all other videos in the project. If a drawing has been applied to all videos videos in the project by clicking on the Apply to all button, then the shapes for any specific video can be moved by clicking on the Draw button.
To begin to draw your shapes, click on the Draw button for the first video in the table. Once clicked, a window will first pop up that contains instructions for how to draw your shapes. The instructions for drawing rectangles, circles, and polygons are slightly different and are described below.
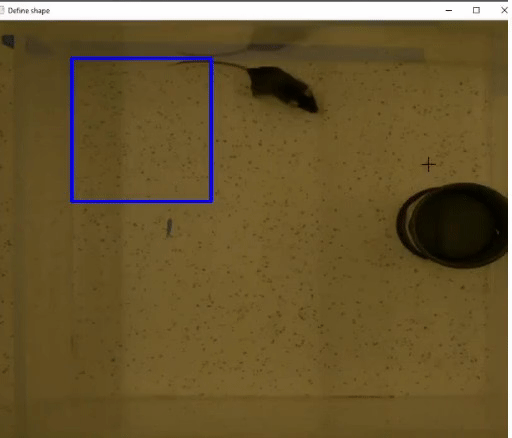
Any user-defined regles will be processed first. The instructions for drawing rectangles will look like the image below on the left, and the process of drawing the rectangle should look like the gif image below:
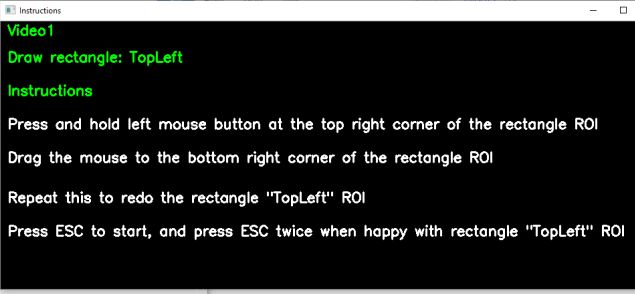
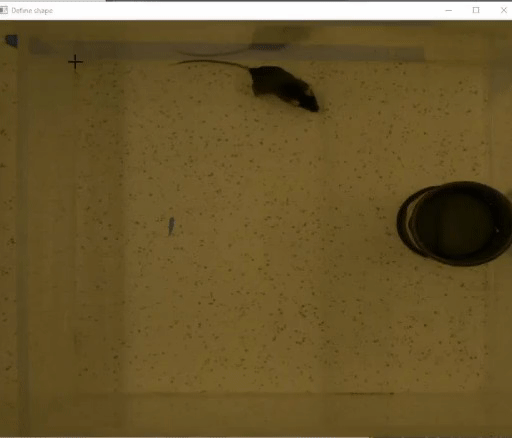
In this example, to begin to draw the rectangle named “TopLeft” on Video1, press Esc. When Esc is pressed, the first frame of Video1 is displayed. Click and hold the left mouse button at the top left corner of rectangle “TopLeft” and drag the mouse to the bottom right corner of the rectangle. If you’re unhappy with your rectangle, start to draw the rectangle again by holding the left mouse button at the top left corner of your, new, revised, rectangle. The previous rectangle will be automatically discarded. When you are happy with your rectangle, press Esc twice to save your rectangle and move to your next shape.
Note
If the image of the first frame of the video looks distorted, and the aspect ratio appears to be off, then grab the side of the window that contains your frame and correct the aspect ratio. If the first frame of your video contains the experimenter hand, or no animal(s) are visible (because the camera was turned on before the animal(s) was placed in the arena), then consider going back and pre-process your videos appropriately
Once all user-defined rectangles have been drawn, any user-defined circles will be processed. The instructions for drawing circles will look like the image below on the left, and the process of drawing the a circle should look like the gif image below:
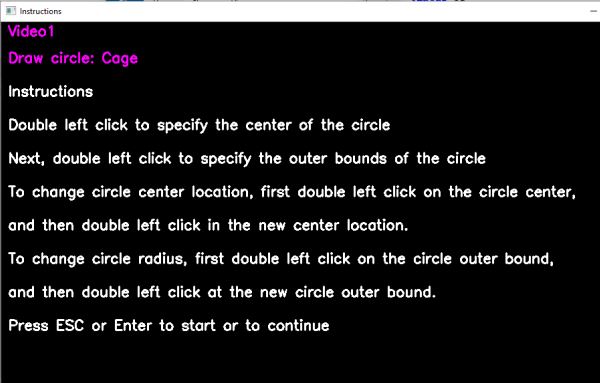
In this example, to begin to draw the circle named “Cage” on Video1, press on Esc. When Esc is pressed, the first frame of Video1 is displayed. If you have drawn any rectangles previously, then these rectangles will also be displayed on the frame. Begin by double left mouse clicking on the image where you would like the center of the circle to be. Next, double left click on the image where you would like the outer bound of the circle to be. If you are unhappy with the center of the circle, then double left mouse click on the center of the circle, and double left mouse click again at the new circle center location. Likewise, if you are unhappy with the outer bounds and the diameter of the circle, then double left mouse click on outer bounds of the circle, and then double left click again at the new circle outer bounds location. When you are happy with your circle, press Esc to save your circle and move to the next user-defined shape.
Once all the circles have been drawn, any user-defined polygons will be processed. The instructions for drawing polygons will look like the image below on the left, and the process of drawing the polygon should look like the gif image below:
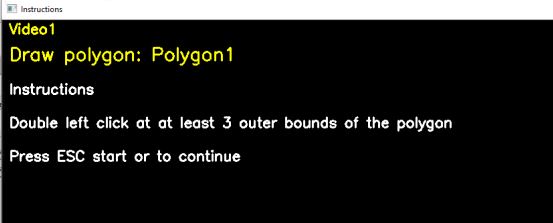
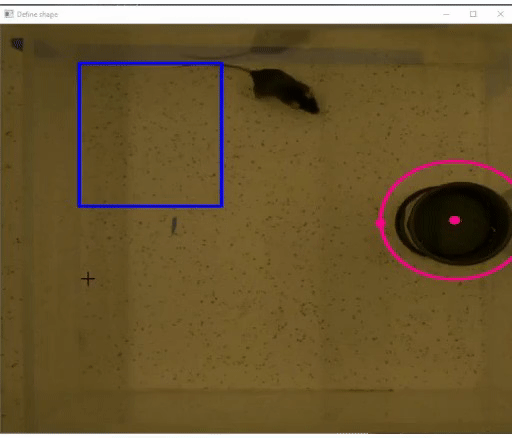
In this example, to begin to draw the polygon named “Polygon1” on Video1, press Esc. When Esc is pressed, the first frame of Video1 is displayed. If you have previously drawn any rectangles or circles, then these rectangles and/or circles will also be displayed on the frame. Click on at least three different locations in the image that defines the outer bounds of “Polygon1”. SimBA does currently not allow re-definitions of the bound locations of the polygon once they have been specified. If you are unhappy with your drawn polygon, you can chose to either (i) move the entire polygon in a later step (see Step 6, just below), or Reset the drawings and start again (again see Step 6, just below). When you have finished your polygon, press Esc to save your polygon and move to the next user-defined shape (or to finish, if all user-defined shapes have been drawn).
If you have finished the drawings for Video1, and you are not entirely happy with the drawings, you can either: (i) click on the Reset button next to Video1: this will delete the drawings you have made on Video1, and you can now again click on Draw button next to Video1 to restart your drawing as described in Step 5 above. Alternatively, you can click on Draw again without first clicking on the Reset button. This allows you to move the shapes in Video1 that you have previously drawn.
When you click on Draw again, without first clicking on the Reset button, then the following instruction window will pop open (below left), and moving the shapes should look like this below:
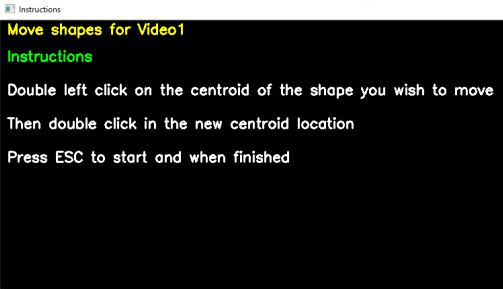
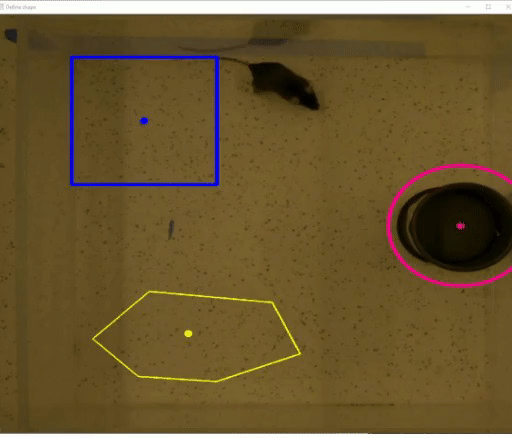
To start moving the shapes that has previously been drawn, first click on the centroid belonging to the shape that you wish to move. This will initially cause the shape to disappear. Next, double left click on the new centroid location of the shape you are moving. This will display the shape in its new location. When you are happy with the locations of all of your shapes, then press on Esc to save the new shape locations.
Once all the shapes have been drawn on a single video there are two possible routes to getting the shapes drawn on all of the videos in the project. The first alternative, which is likely the more time-consuming option, is to click on each of the Draw buttons associated with each video, and replicate Step 5 for all of the videos in your project. The second route, and likely the faster and more standardized option, is to replicate the shapes drawn on Video1 in all of the videos of the project, and then nudge them to the correct location in each of the videos (if the camera/arena moved slightly across recordings).
Note
If the camera moved significantly across the different recordings in the project, the first alternative route described above is the only option to generate accurate all the ROI shapes in each video.
To replicate the ROI shapes drawn in Video1 to all of the videos in the project, click on the Apply to all button next to Video1. Once done, click on Draw for Video2. When you click on Draw for Video2, a window will pop open with Instructions for how to move shapes - press Esc to proceed. When pressing Esc the first frame of Video2 will be displayed. Now move the shapes so that they are in the correct locations (as described in Step 6 above), and press Esc to save the locations of the shapes.
Repeat this step for all of the videos in the project. Once complete, close the ROI Table window, and navigate back to the ROI tab in the Load project window.
Note
If you at any point want to look at, or modify, the defined ROI shapes for each of the videos, click on the Load defined ROI table button in the ROI tab under the Load project menu.

Likewise, if you’d like to delete all the shapes you have drawn for all of the videos and start fresh with new shapes, go back and repeat the above [Part 1 - Step 3]
Part 2. Analyzing ROI data
You can now generate CSV files containing descriptive statistics for the the number entries into each ROI shape, and the time spent within each ROI. SimBA allows you to generate these measures for up-to 2 body-parts (or two animals) in any one video for any one analysis. If you would like to get these measures for more than 2 body-parts, then we suggest that you simply run the analysis multiple times.
To analyze your ROI data, first click on
Analyze ROI datain theAnalyze ROIsub-menu. The following menu will pop open: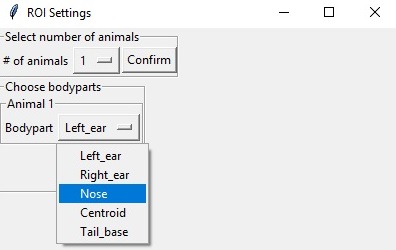
Here, begin by selecting the number of animals (or body-parts) you wish to produce the ROI descriptive statistics for, and then click confirm. A second sub-menu will appear below named Choose bodyparts. This menu will contain as many dropdown menus as the number of animals (or body-parts) selected in the Select number of animals menu. Each of these drop-down menus will contain the body-parts used to track the animals in pose-estimation. Select the body-parts you wish to use when calculating the ROI entry and time data.
At the bottom of this window, you’ll see an entry box named Bp probability threshold (the first arrow in the image below) and a tick box option named calculate distance moved within ROI (the second arrow in the image below).

Bp probability threshold: If you can, we strongly recommend to pre-process all videos, and remove any segments of the videos where animals are not present in the video as documented [HERE] prior to perfroming pose-estimation and importing videos into SimBA. However, if this is not possible, we can filter out out frames where probability for the pose-estimation accuracy is low, and not use these frames when we calculate the location of the animal in relation to the ROI (i.e., useful if you have an animal leaving the frame and the pose-estimation predictions are jumping all over the place). To filter out these frames, increase the probability threshold (DEFAULT = 0.0. I.e., all frames will be treated as the animal is present).
calculate distance moved within ROI: This tick-box option allows you to calculate the distance (in millimeters) that each animal has moved within each of your ROIs. If you run the analysis with this box ticked, SimBA will generate a time-stamped CSV file inside your project log folder named something akin to this: Movement_within_ROIs_20210320143608.csv. This file contains one row per analyzed video, and one column for each ROI and analyzed body-part. If you open this CSV up after analysis, you can expect it to look something like this (click here to enlarge):

This CSV file tells me - for example - that in Video10, the animal named Animal_1 moved 1104 millimeters within the ROI shape named rec_1 (looking in cell B2).
Note
A short note on how simba calculates movements within ROIs: Pose-estimation tracking data can contain significant jitter. That means that even if the animal is standing still, the tracked body-part location can “jump around” a few pixels between sequential frames. Thus, if we calculate the movements of the body-parts between each sequential frame and add it up, it appears that the animal is moving a lot more than it actually is. To solve this, we bin the data into seconds, and calculate the movement of the body-part at the beginning of the second till the end of that second, and sum those values to get the movement distance of the animal.
Click Run to perform the ROI analysis.
Once complete, a statement will be printed in the main SimBA terminal window noting that the process is complete. The ROI descriptive statistics can be found in the Project_folder/logs directory in two time-stamped files.
One file will be named
ROI_entry_dataand contain the number of entries into the different ROIs. It also contains the percent of entries into each ROI over all of the ROI entries. For an expected output ROI entry CSV file, click [HERE]A second file, named
ROI_time_data, contain the time spent in in seconds the different ROIs. It also contains the percent of the session time spent in each of the ROIs. For an expected output ROI time CSV file, click [HERE]
Note
As of Feb-26 2021, the SimBA ROI analysis also generates a sub-folder within the Project_folder/logs directory named `Detailed_ROI_analysis`. This folder contains additional information, with exact time-stamps of when animals enter and exits user-drawn ROIs. For each analysed video, SimBA will generate one date-time stamped CSV file located in the project_folder/logs/Detailed_ROI_analysis directory. These CSV files files will contain 4 columns: Animal_name, Shape_name, Entry_frame, and Exit_frame, and look something like this:
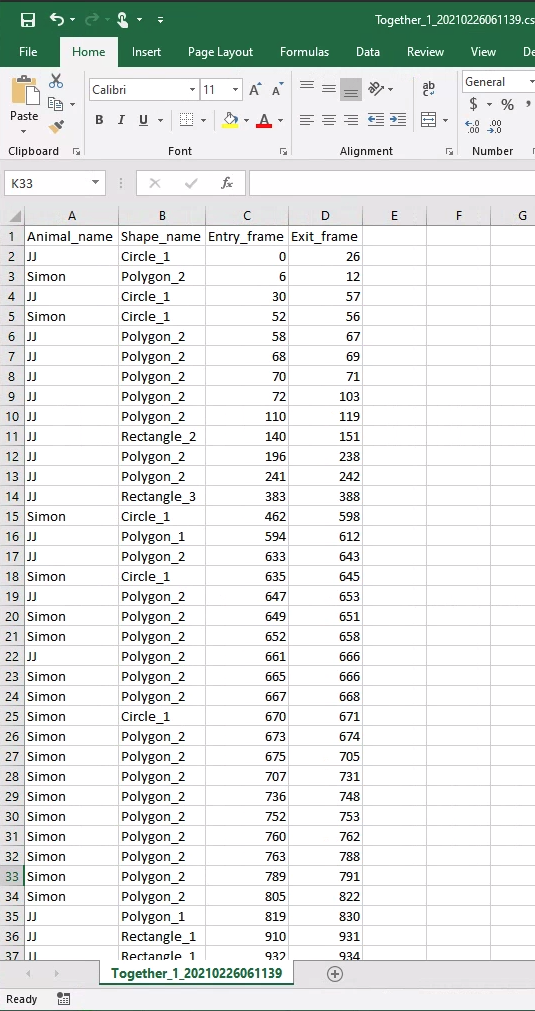
Consult these files if you want to know the exact frame numbers when animals entered and exited your drawn ROIs. If you want to convert the frame numbers to time-stamps, then divide these numbers with the fps of the video.
Part 3. Generating features from ROI data
With the ROI information, we can generate several further features that might be useful for predicting behaviors, or be handy within other third-party applications. For each frame of the video, the following features can be added to a previously calculated battery of features:
Boolean (TRUE or FALSE) value noting if the user-selected bodypart is located within or outside each of the ROIs
The millimeter distance between the animal body-part and the center of each ROI
The cumulative time spent in each of the ROIs
The cumulative percentage of the total session time spent in each of the ROIs
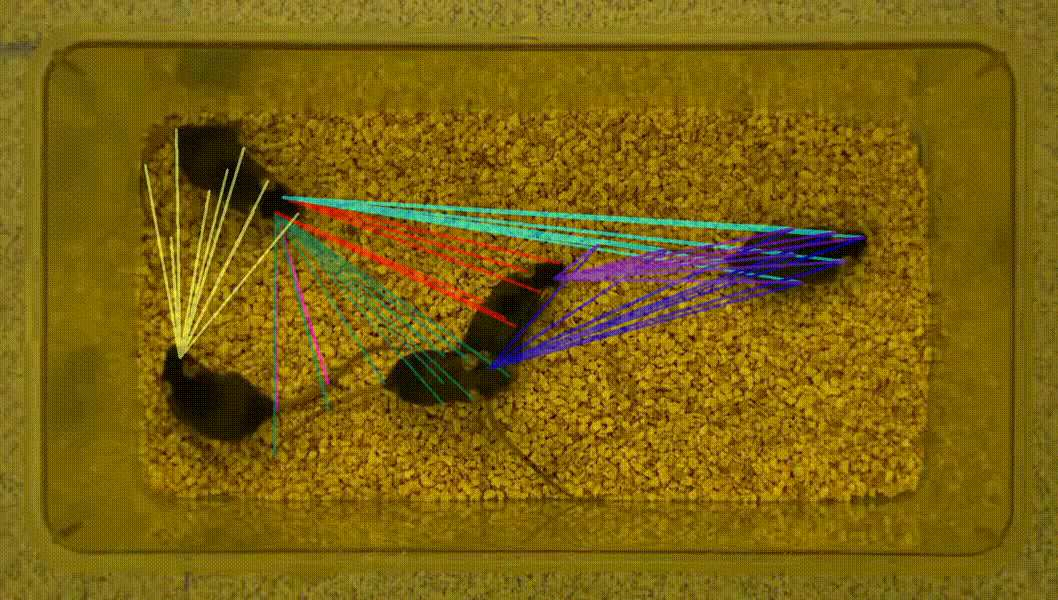
If the users are using the the recommended body parts (including nose, left ear, and right ear), SimBA will also calculate if the animal is directing towards each of the ROIs:
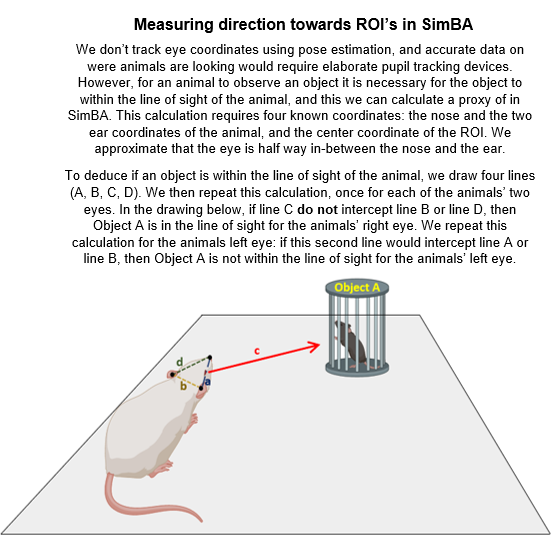
Using the directionality measure described in the image above, we can calculate further potentially informative features from each frame for subsequently generated machine learning models:
Boolean (TRUE or FALSE) value noting if the animal is directing towards the center each of the ROIs or not.
The cumulative time spent directing towards each of the ROIs.
The cumulative percentage of the total session time spent directing towards each of the ROIs.
To generate these features and add them to the battery of features already calculated, begin by navigating to the Extract features tab.
Note
To calculate ROI based features it is first necessary to extract the non-ROI based features. If you haven’t done so already, go ahead and first click on Extract features under the Extract features tab. A message will be printed in the main SimBA terminal window when the process is complete.
Next, click on
Append ROI data to featuresunder the Extract features tab. The following menu will pop open:
This menu is very similar to the Analyzing ROI data submenu described in [Part 2 - Step 2] above. First, begin by selecting the number of animals (or body-parts) you wish to use to calculate the ROI features for, and then click Confirm. A second sub-menu will appear below, named Choose bodyparts. This menu will contain as many dropdown menus as the number of animals (or body-parts) selected in the Select number of animals menu. Each of these drop-down menus will contain the body-parts used to track the animals. The body-part(s) choosen in this menu will determine which body-parts is used to calculate ROI-based features. For example, if you select the Nose body-part, the cumulative time spent in each of the ROIs, as well as all other features, will be calculated based on the Nose body-part. Once you have chosen your body-parts, then click on Run.
Once complete, a statement will be printed in the main SimBA terminal window noting that the process is complete. New CSV files will be generated for each of the videos in the project, located in the
project_folder/csv/features_extractedfolder. If you open these files using Microsoft Excel or OpenOffice Calc (watch out, they might be fairly large and therefore difficult to navigate manually) you will see several new columns at the end of the CSV: these columns contain the ROI-based features.
To proceed and generate machine learning classifiers that use these features, continue reading the Label behavior step, followed by the Train machine models parts of the SimBA tutorials.
Part 4. Visualizing ROI data
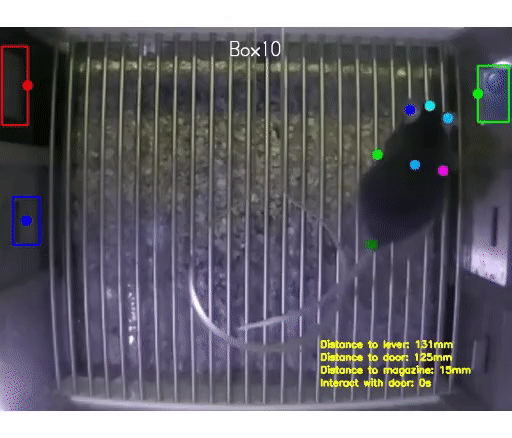
You can now generate visualizations of the ROI data for each of the videos in your project. To generate the visualizations, click on Visualize ROI tracking in the Visualize ROI submenu of the ROI tab. This will generate visualizations of the ROI and tracking data, like in these gifs:
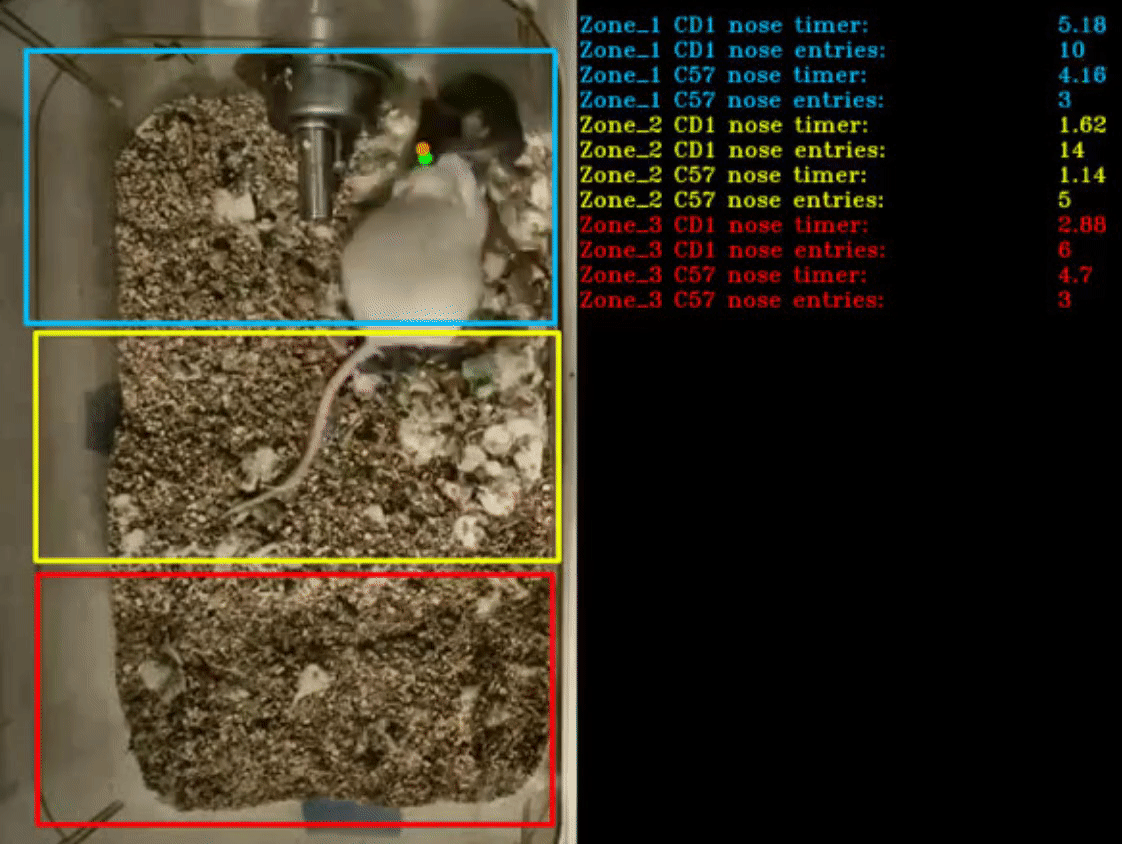
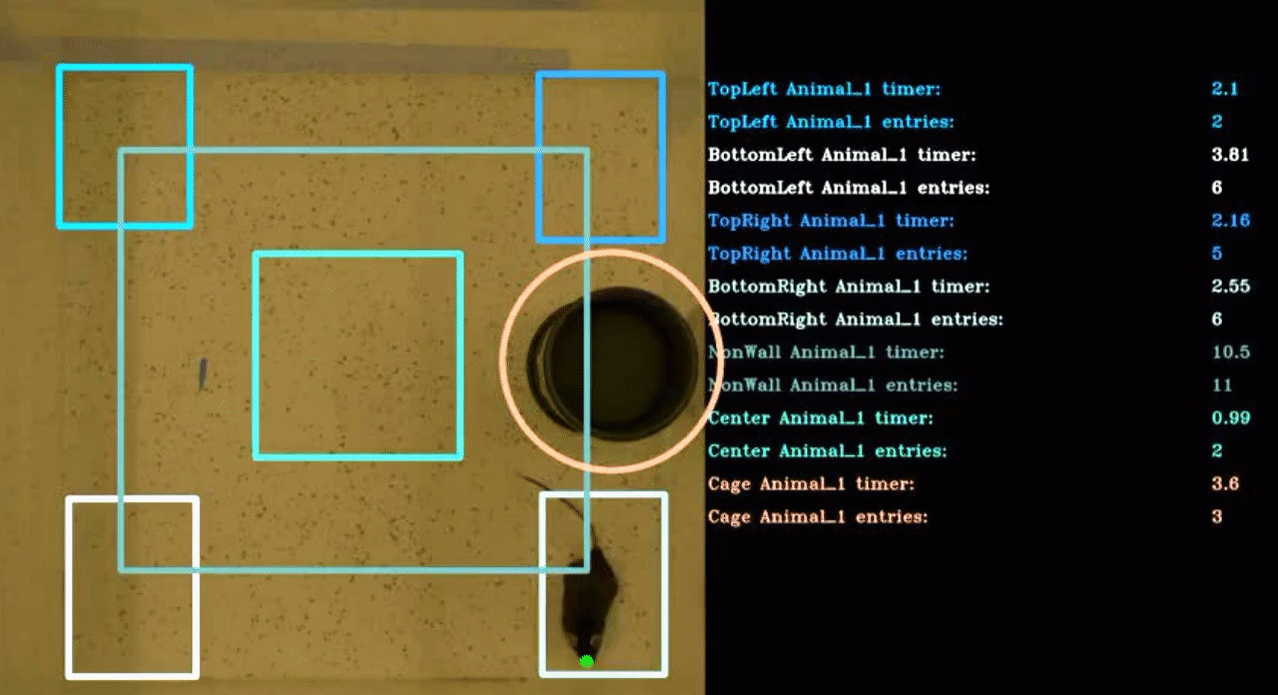
Clicking on Visualize ROI tracking will generate visualizations for all of the files located in the project_folder/csv/features_extracted folder. The visualization process will use the body-parts specified in Analyze ROI data step described in [Part 2 above].
The visualization process will generate one output video for every input video. For example, if you are generating visualizations for Video1, then the output mp4 video will be located in the following path: project_folder/frames/output/ROI_analysis/Video1.mp4.
Part 5. Miscellaneous ROI tools
Heatmaps
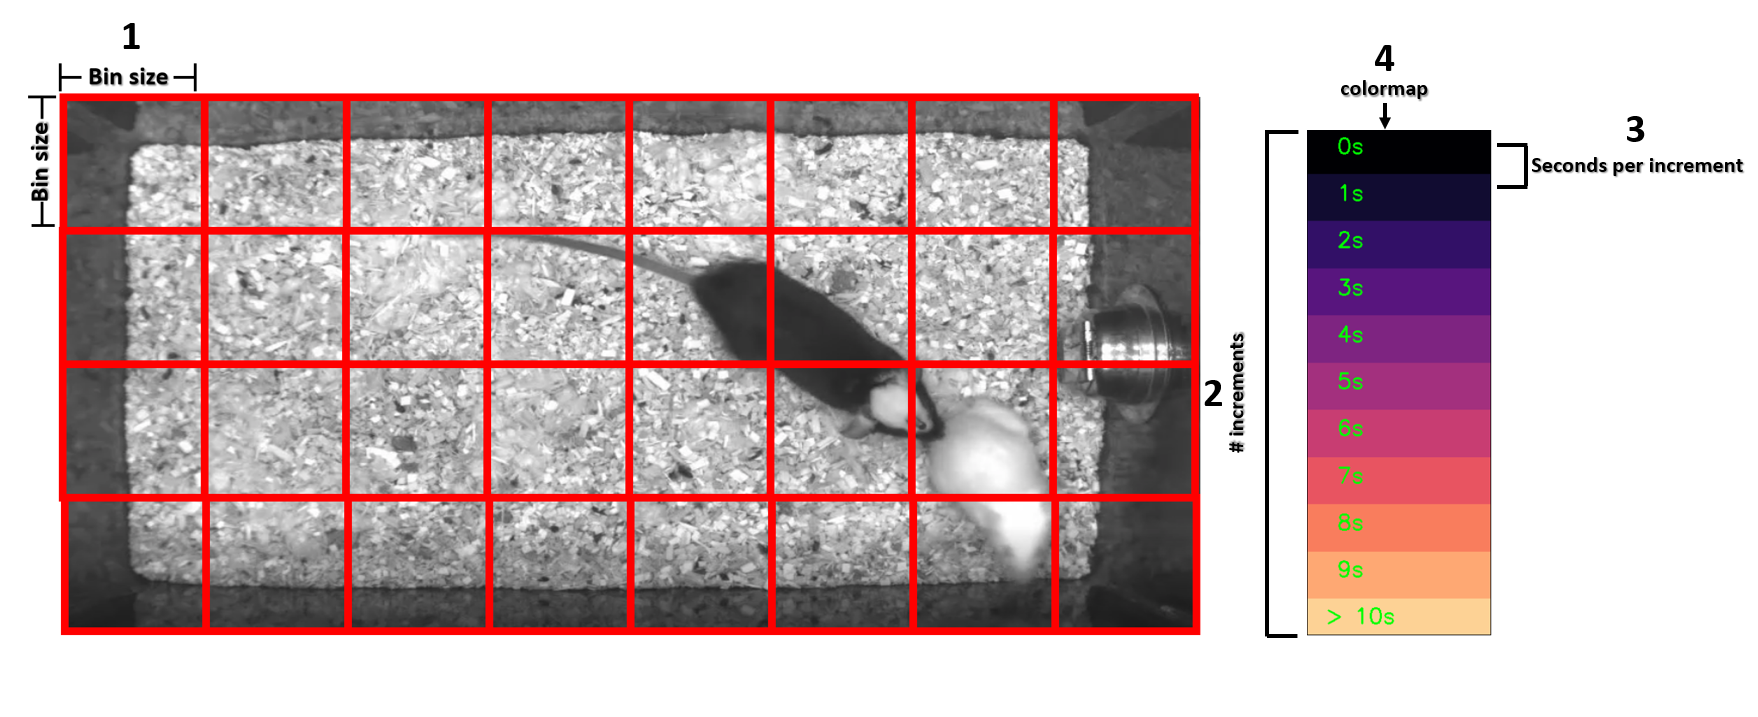
Users can generate heatmaps - in video or image formats - that represents the time spend in different regions of the arena. Note, this tool does not depend on user-drawn ROIs: instead this tool is for visualizing time spent in all regions of the arena according to user defined region sizes and user-defined color-scales. As an example, this tool is used for generating images, or videos, resembling this image below. For an example of the heatmap tool output in video format, check the [SimBA YouTube playlist].
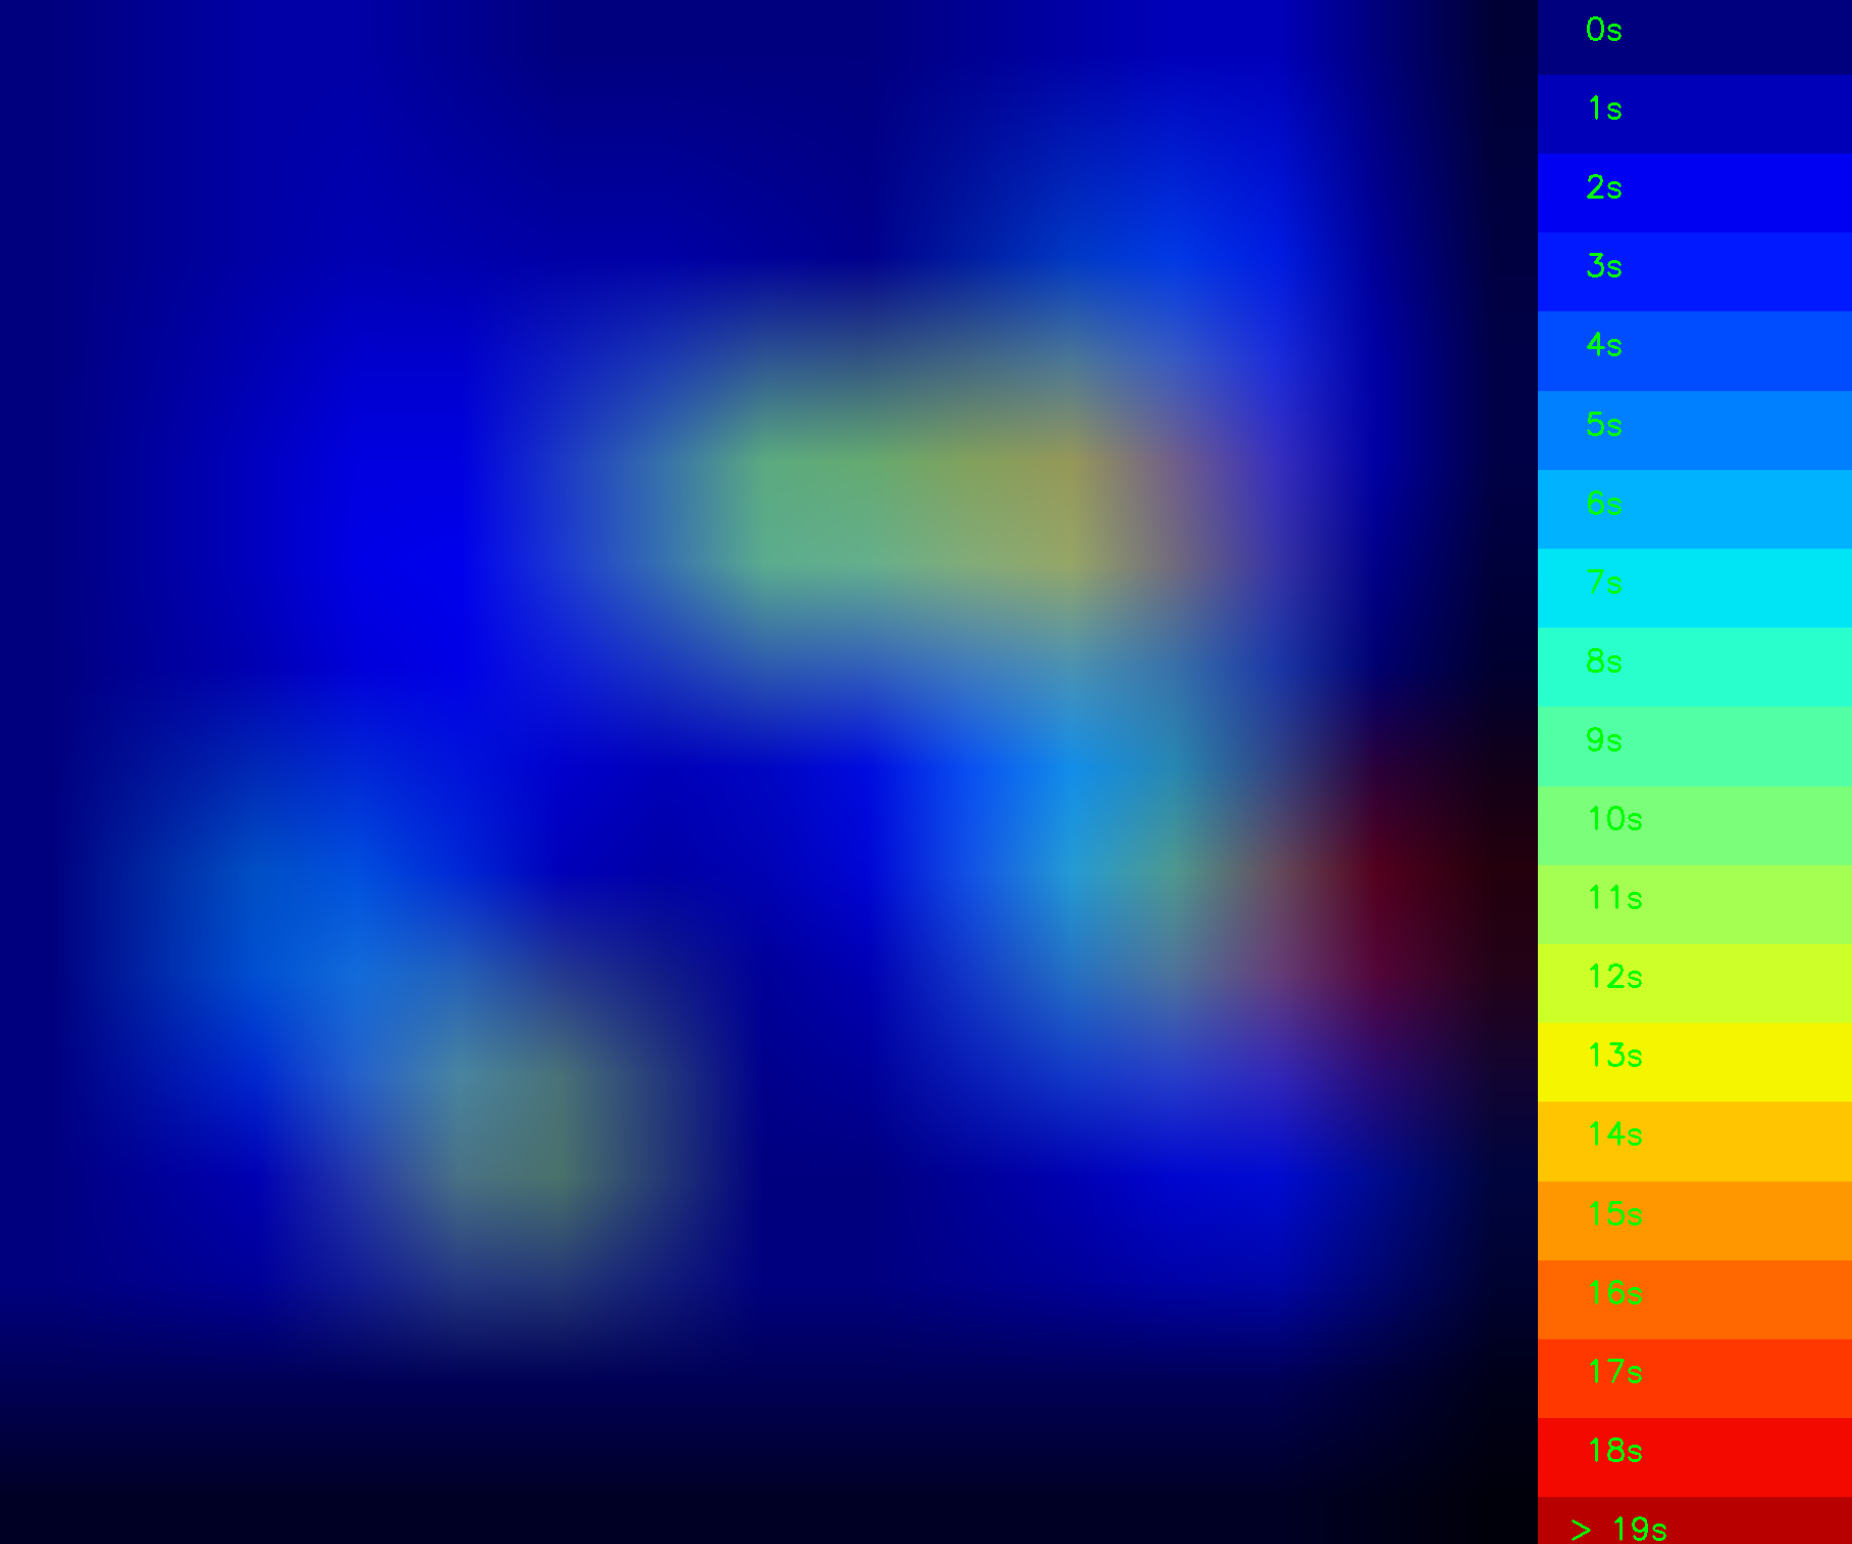
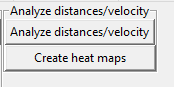
These heatmap images, or videos, are colour-coded according to the time spent in different parts of the arena. To generate such heatmaps, begin by clicking on the Create heatmaps button in the ROI tab:
When clicking on Create heatmaps, the following menu pops open which accepts several required user-defined parameters:
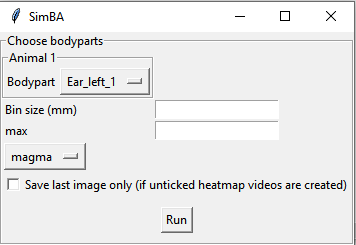
1. Bodypart:SimBA can, currently, only generate heatmaps representing the time spent in different regions of the image based on a single body-part. Use the drop-down menu to select the body-part you wish to use to generate the heatmaps.
2. Bin size (mm):To generate heatmaps, SimBA needs to divide the image into different square regions. Use this entry-box to define the size of each square region. To get a better sense of what aBin size (mm)is, and how SimBA goes about generating the heatmaps, see the image below (1). For example, enter 50 in this entry box to get regions that are 5x5cm in size.
3. # max ('auto' or integer):The created heatmaps have adjoining colorbars. In this entry box, define the number of seconds that should represent the strongest color and max value in your heatmap. Users can also insert the stringautoin this entry-box. Ifauto, the SimBa will calculate the max value in the video (max time spent in a single zone) and use this value as max (I’m not entirely sure how these heatmaps are created in commercial tools but I was inspired by the [MATLAB Pathfinder tool].
4. Palette. Use the drop-down to specify the palette of the heatmaps. For reference of how the palette looks like, see the the [SimBA visualization tutorials - Step 9]
7. Save last image only. Users may want to (i) generate videos, where each frame of the video represents the cumulative time spent in each region up until the current point in time, or (ii) generate single images that represents the cumulative time spent in each region across the entire videos. Tick theSave last image onlybox to generate a single PNG images for each video in the project. Untick theSave last image onlybox to generate one heatmap video for each video in the project.
Once this information is entered, click Run. Generated heatmap videos/frames are saved in the project_folder/frames/output/heatmap_location directory.
‘Directionality’ between animals
To analyze and visualize how animals are directing towards each other, rather than user-defined ROIs, head to THIS TUTORIAL