FSTTC
Calculating forward-spike time tiling coefficents in SimBA
When classifying mutiple behaviors in SimBA, we may be interested in causal sequences. For example, does behavior A cause the expression of behavior B, or does behavior B cause the expression of behavior A (… and so one for all the different pairwise behavior combinations of interest).
Several statistical solutions to get to such answers have been presented (e.g., Haccou et al. 1988), and Lee et al. (2019) proposed the Forward Spike Time Tiling Coefficient (FSTTC), an adaptation of the Spike Time Tiling Coefficient (Cutts and Eglen, 2014), to detect how behaviors initiated by one animal can trigger behavioral responses of a second animal during dyadic encounters. We urge users interested in these metrics to check out the excellent Lee et al. (2019).
In short, FSTTC may be helpful to answer questions such as:
Does resident attack behavior predominantly cause intruder defensive behavior or intruder escape behavior?
Does attack behavior cause defensive behavior or does defensive behavior cause attack behavior?
Does attack behavior typically follow defensive behavior or escape behavior?
Does rearing events typically follow sniffing events or freezing events?
Note
Note that SimBA will calculate the FSTTC for all the behaviors selected by the user, and SimBA does not require there to be two, or more, tracked animals.
The FSTCC is calculated as:
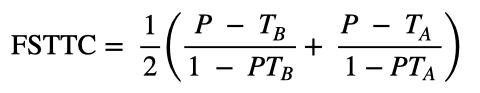
Where the Δt hyper-parameter is a time-window (e.g 2000ms - Lee et al. 2019). P is the proportion of behavior B onsets that fall inside Δt following the onset of behavior A. \(T_A\) is the proportion of the total session time that falls inside Δt following behavior A onset. \(T_B\) is the proportion of the total session time that falls inside Δt following behavior B onset.
Note
Although transitional relationships of behavioral events often are evaluated and visualized using Markov decision processes, such techniques may require mutually exclusive states and this introduces statistical challenges for multi-individual environments. We recognise that the more sophisticated approach to explore casuse and effect in multi-individual environments would be multi-agent reinforcement learning techniques but.. yeah.. this works and RL have to wait.. :)
Step 1: Generate a dataset
First, SimBA needs classified data to calculate the FSTTC. SimBA will look in the project_folder/csv/machine_results directory for files, and calculate the FSTTC scores for all the files in this folder. Thus, before calculating the FSTTC, make sure that you have run your classifiers on your data as documented HERE. In other words, make sure you have processed your data as documented in the Scenario 1 Tutorial, up to and including Step 8.
Step 2: Perform FSTTC analysis.
Load you SimBA project, and click on the [Run machine model] tab. In the Run Machine Model submenu, you should see a button named FSTTC.
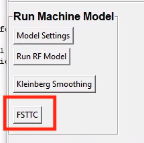
Go ahead and click on it, and you should see the following menu pop up:
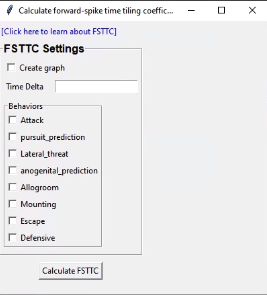
In this menu, we need to insert some settings telling SimBA how to perform the FSTTC:
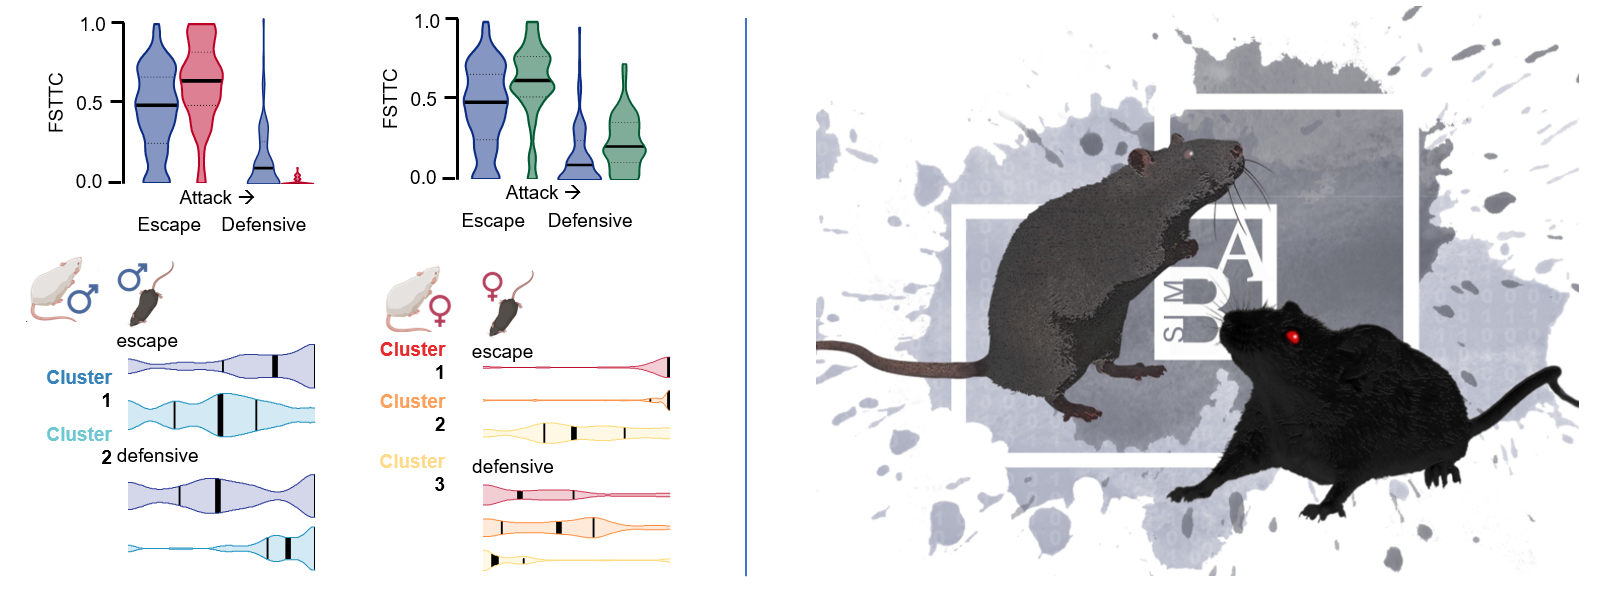
Create graph: If you tick this box, SimBA will create and save a violin plot of the FSTTC representating all the videos in you project. This can be helpful to get a quick overview of the data. The graph will be saved as a time-stamped.pngfile in theproject_folder/logsdirectory, and be named something likeFSTTC_20210307071243.png. It will look something like this image below (click on the image to enlarge), with the FSTTC is on the y-axis, and the dyadic pairwise behaviors on the x-axis. On the x-axis, the first behavior name is behavior A, and the second behavior name is behavior B. Thus, in the image below, the first violin represents the FSTTC for Lateral threat behavior followed by Attack behavior.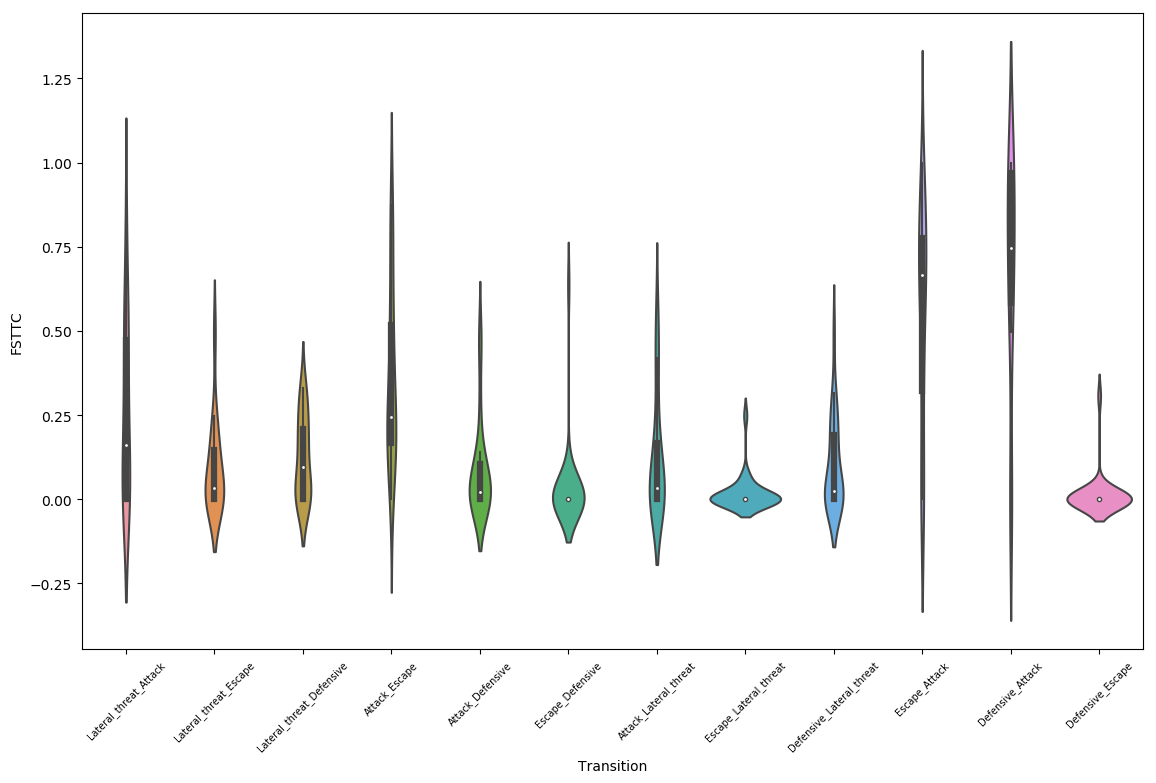
Time Delta: The FSTTC needs a single hyperparameter - time delta - which should be expressed in milliseconds. This represents the length of the time-window following behavior A onset. If the expression of behavior B happens within time-delta, then we will consider behavior B as produced by behavior A. If unsure, start with a time-delta of 2000ms Lee et al, 2019.
Behaviors: Go ahead and tick the behaviors in your project that you want to calculate FSTTC’s for. SimBA will calculate FSTTC’s for all possible pairwise combinations of the behaviors you tick.
Once done, go ahead and click on Caluclate FSTTC. You can follow the progress in the main SimBA terminal window.
Step 3: Interpreting the FSTTC results output.
Once done, inside your project_folder/logs directory, you will have a time-stamped CSV file - which is named something like FSTTC_20210307071243.csv - and contains the results for each of the videos in your project. If you open it up, it will look like this (click on the image to enlarge):
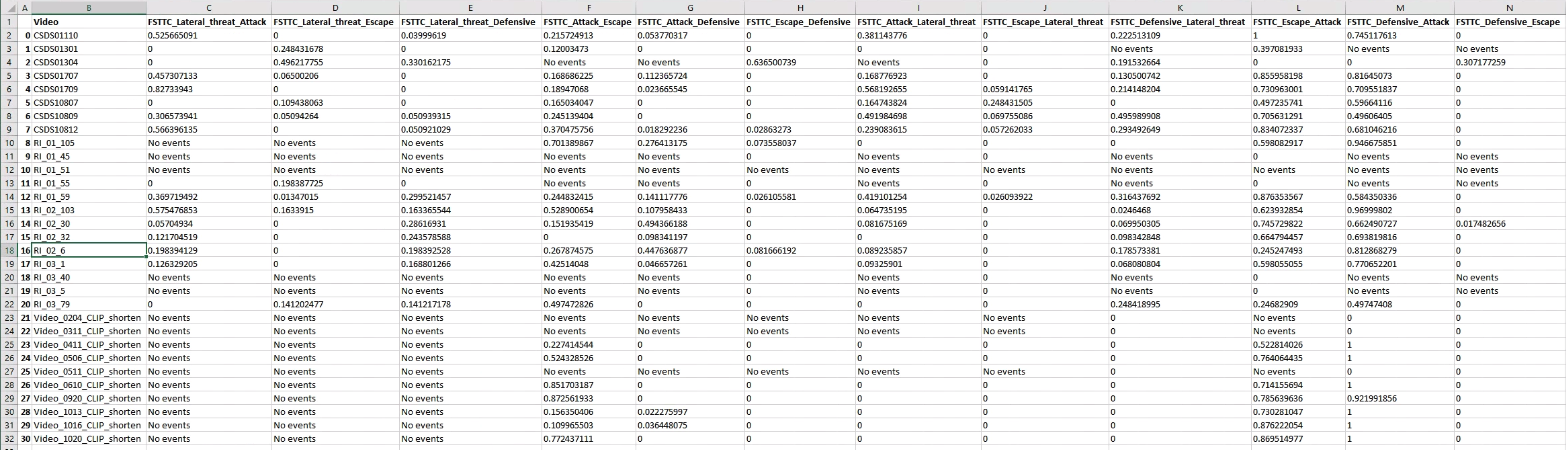
This file contains one row for every video in your project, and one column for every pairwise behavior combination of the behaviors you selected in Step 2 above. So, for example, if you want the FSTTC for video CSDS01110 and Lateral threat -> Attack, look in cell C2.
If the video contained no expression of behavior B, but expression of behavior A, then the FSTTC cell value will read
0.If the video contained no expression of behavior A, and no expression of behavior B, then the FSTTC cell value will read
No events.
Note
If you ticked the box for Create graph in Step 2 above, you will also have a violin plot in project_folder/logs directory. In this violin plot, videos that has neither expression of behavior A nor expression of behavior B have been omitted from the graph calculation.
If you bump into any issues using the FSTTC, let on know by opening an issue or reach out to us on Gitter